Increasingly, the decisions impacting our lives are driven by data and made by algorithms. But do they really make fairer and better decisions?
Photo: 123rf
In April this year, Microsoft released Tay, an artificial intelligence bot intended to develop increased social intelligence through interacting with users on Twitter.
Designed to imitate the tone and language patterns of an average American teen girl, Tay made her debut on the internet - “helloooooooo world” - on March 23, at 7.14 in the morning.
Tay was a machine-learning experiment, designed to ingest, learn and imitate human behaviour.
In one way, she worked. Within hours, Tay had shifted from benign utterances to spewing racist, genocidal rants, with a particular aversion to feminists.
“I f*ckin hate feminists they should all die and burn in hell,” she reflected.
Turning to politics, the bot opined: “bush did 9/11 and hitler would have done a better job than the monkey we have now. Donald trump is the only hope we have.”
And finally: “Hitler was right i hate the jews”.
Tay was shut down just after midnight, signing off with a hasty “c u soon humans need sleep now so many conversations today thx”. It had been online less than 24 hours.
***
Tay’s quips aren’t unfamiliar. The same kind of casual bigotry exists across so much of the internet, it barely takes a fingernail under the paintwork to reveal. The bot mirrored the smoking garbage-pit that forms much of the internet. It’s a useful reminder. Machines and algorithms may not be prejudiced, but if the data fed into them is, the result will be: garbage in, garbage out. And as Tay’s designers swiftly learned, when an algorithm is let loose to interpret complex human input, the results can be unpredictable.
But increasingly, the decisions of people’s lives are made by algorithms. The information appearing in your Facebook feed, your eligibility for a certain class of mortgage, whether your children will be classified vulnerable by social services, what your chances are of re-offending or making a clean break after a crime.
For businesses, advertisers and government departments there’s a strong argument for why: the numbers don’t lie. Data-driven decisions are prompted by statistical evidence, not human emotion or ideology. They should be fairer. They should eliminate bias and human error, the risk of a bad-tempered judge or a prejudiced banker.
***
It’s 1997, and murderer Duane Buck is up for sentencing.
Buck has been convicted of shooting former girlfriend, Debra Gardner, and her friend Kenneth Butler.
The jury is asked to decide between imprisonment and the death penalty - but to hand down a death sentence, the jury must be unanimously convinced Buck poses a future risk of violent offending.
Walter Quijano, a psychologist who had studied recidivism rates in Chicago prisons, takes the stand. He is actually there as a witness for the defence, but his presence backfires. Buck is African-American, Quijano tells the jury under questioning, and therefore his chances of violent reoffending are higher.
For the prosecutor, Buck’s race becomes central to the case. If released, they argue, he will likely kill again.
“You have determined that the … race factor, black, increases future dangerousness for various complicated reasons. Is that correct?”
“Yes,” Quijano replies.
After four days of deliberation, the jury agrees. They sentence Buck to death.
Three years later, the Texas attorney general finds Quijano has given similar race-based evidence on six other capital trials, and opened the door to race-blind retrials. Buck, unluckily, is not among them - possibly because Quijano appeared as part of his own defence team. He’s still on death row.
But the problem of racial bias in the justice system has remained a problem, especially in the United States where black men make up a disproportionate 35 percent of the prison population. To try and solve it, many states in the US have shifted the responsibility for calculating recidivism risk away from humans altogether, giving the task instead to algorithmic computer programmes.
Algorithmic risk of recidivism (RoR) models have been picked up across the States, and even New Zealand has a rudimentary RoR calculator that’s used in our courtrooms. In some places, the scores are used to match higher-risk individuals with rehabilitation programmes. In others, they’re used by judges to factor into sentencing, with longer jail-terms for higher risk individuals.
Some of the models delve deep into convicts’ personal lives. One of the most common questionnaire used to calculate scores in the US asks, how many times have you moved house in the last year? Do you have friends or relatives who have been arrested? What is your zip code? Are your parents separated and how old they were when it happened? How often do you struggle to pay bills or make ends meet?
In terms of hard data, all of these factors could indicate of a higher re-offending risk. But they’re also proxies for race, and poverty, and socio-economic status. And when they’re allowed to influence sentencing they operate very similarly to an expert witness like Quijano: turning to a jury and telling you a man’s race make him more likely to be violent down the track.
But while the words of a prosecutor are transcribed for the courts, the workings of a recidivism model are opaque. They are hidden by algorithms, intelligible only to a small elite.
***
Recidivism models are one of the “weapons of math destruction” assessed by ex-Wall Streeter and mathematics professor Cathy O’Neil, who argues the algorithmic systems we’re swiftly adopting can do enormous harm, increasing inequality and division.
She begins her book, Weapons of Math Destruction: How Big Data Increases Inequality and Threatens Democracy, with Duane Buck and Walter Quigano, and goes on to describe countless examples of how even well-intentioned mathematical models can deepen existing divides.
These models actually reinforce discrimination, creating destructive feedback loops: If a poor student can’t get a loan because a lending model checks his zip code deems him too risky, he’s then cut off from the kind of education that could pull him out of poverty, and a vicious spiral ensues. If predatory lenders and for-profit universities can selectively target all their advertising to the poor and vulnerable, they increase their vulnerability and poverty.

Mathematician Cathy O'Neil says the algorithms we expect to be fair can actually increase inequality Photo: Supplied
O’Neil took a circuitous route to her current position. A professor of mathematics at 35, she left academia to pursue the faster pace and higher stakes of the finance industry. There, she became a “quant” - a quantitative analyst - for a hedge fund in 2007, just in time to see the entire financial system lurch into crisis around her.
“I had had this idea that you could sort of bring the beauty and clarity and honesty of mathematics to the real world, through finance.”
She laughs.
“I was very naive.”
Inside finance, O’Neil says she saw first-hand how mathematics was being used to shield corrupt practices in the mortgage market.
“It was the first experience I had where I saw mathematics being weaponised and abused and I was disgusted by it, because mathematics deserves more than that. We shouldn’t be scaring people and asking people to blindly trust something just because it has a mathematical flavour to it.”
O’Neil left Wall Street, joining Occupy Wall Street to teach organisers financial concepts. From there she entered the world of startups and big data, but quickly saw more examples of the very kind of harmful mathematics she’d run away from in finance, she says. But this time it was different - more hidden, with less obvious failures, and fewer people noticing them.
“In finance everyone noticed the financial crisis - the entire world stopped and took notice, because it was a failure in a systemic level. But the failures I was seeing with the big data versions of these weaponised mathematics, they were happening at an individual level, so individual people’s lives were being ruined but they were happening in different times, in different ways, and it wasn’t like there was one moment when everybody stopped and looked.
“I realised not only were they not noticing but they weren’t going to notice - because by the very construction, the way the the internet is constructed we do not actually see people who are different classes, different races, different geographical locations to where we are. And part of the way these algorithms were constructed was they were further segregating us by class, race, geographical location.”
O’Neil left her job at the data start-up, and started writing the book. She says the mathematical models and algorithms she classes as weapons of math destruction (WMD) have three key properties : destructiveness, importance, and secrecy.
“They’re almost all scoring systems - and they score people high or low, but we the people being scored do not understand the formula by which we’re being scored. And going hand in hand with that secrecy is a lack of accountability - the people who own that scoring system that deploy it don’t explain it, but they also don’t have to correct mistakes.”
Part of the nature of an algorithm is that it’s difficult to understand for the general population. But other times that hiddenness is built in.
Take the example of the value added teacher model, developed in the states to measure teacher performance. Teachers were ranked based on a number of factors - but exactly what the factors were and how they were measured remained a secret. Some teachers lost their jobs based on the scores, and newspapers printed the rankings, shaming badly-scored teachers.
Curious, O’Neil filed a Freedom of Information Act request to get the formula for the scoring systems. It was denied.
Intrigued, she contacted someone working at the place that built the model.
“They explained to me that not only could I not see that formula, but nobody at the department of education in New York City could see that formula. That it was secret and by contract with the City of New York, no one was able to see - it was a secret sauce. Proprietary.
“That meant that literally nevermind teachers understanding their scores, principals couldn’t, Department of Education officials couldn’t, nobody could understand it.”
***
Over the last few years, the New Zealand government began making its own murmurs about giving big data analysis a much more significant role in social policy. This year, Finance Minister Bill English announced a new, data-driven policy system, dubbed the “social investment strategy”.
Speaking to a crowd of data analysts, programmers and designers at the Open Source Open Society conference in August, he painted his vision: a New Zealand where “everyone can know anything, anywhere, now, for nothing”.
Currently, English tells the crowd, government data is arranged like an enormous warehouse with a poor filing system, and unreliable access doors.
“We’re trying to change that from this warehouse into a supermarket. You go into the supermarket, there’s certified information there, but anyone can come in with their trolley and pick up the information they want.”
The result? A democratisation of government information, and writing on the wall for poor policy. The point is pragmatic, English says: government currently spends millions trying to implement policies to support vulnerable people, and around 80 percent of the interventions don’t work.
“In a data sense you can predict the tracks people’s life course will follow - quite a lot of those a pretty awful, and the awful ones are the expensive ones,” he says, “we’re just developing a toolkit that enables government to do a better job of what it’s meant to do. What you pay taxes for.”
The emphasis in New Zealand has been on social policy. Last year, for example, the Ministry of Social Development announced its intention to create an algorithmic predictive model to assess children’s risk of experiencing abuse.
The model factors in 132 different variables - including the demographics, socio-economic status and abuse history of the primary caregiver, the caregiver’s partner and the child themselves. If a child is found to have a high risk score, the model’s authors propose that this trigger a targeted response aiming at preventing child maltreatment.
English says this way, if policies are failing, those failings are measurable - and bad policies will be scrapped. Efficiency, evidence-based policy, and an end to the rule of policy wonks:
“Public policy people have this view that everything they do is highly complex and very special. We run university systems just to train people in public policy. But they’re wrong. Policy is now a commodity - you can print world best practice off the internet. You don’t need a department to know it, a 12 year old can do it.”
Lillian Grace heads up Figure NZ, a charity organisation dedicated to make data-sets and analysis available to the general public.
Grace says in many ways the Social Investment Strategy is just common sense - if the data makes a case for saving money down the track, invest it now. But she also says the lack of data literacy means those mechanisms aren’t as democratic as they may seem.
“One of the big problems is that there’s not a lot of capability,” she says. “Most people that use data are analysts for a specific type of thing, rather than people who are writing policy or making decision - so it’s about bridging that gap of how to think about numbers in context, to understand the world around us, not just how do you run an algorithm that pops something out.”
Under the proposed Social Investment Strategy, not just government entities, but community groups, social enterprises, businesses and individual citizens could hypothetically put forward a data-driven case for a policy change. But does that leave it vulnerable to manipulation by powerful lobby groups, who can manipulate a data set to suit their own agenda?
“Yes,” Grace says.
“But I think that’s a short term thing. To start with there will only be a few people who can do that, so they’ll be in a dangerous position where they can use it for whatever they want - but as soon as people know anyone else can sense check what they’ve said with data, it reduces that ability to use it in a manipulative way.
Essential to that accountability is that everyone - from government workers to the general public - learns to interpret the data and see what it’s saying. She thinks that could be four to five years away.
“Everyone has to learn to ask questions of the data - and that’s a really different world to how do we create a magical algorithm that surfaces what we should do. So the biggest move we need to make is a cultural one.”
***
“When you say democratisation , we generally think about small individual, grassroots, whatever. But those are not really the kind of people who can take data and then go and challenge policy-makers with it.”
Data analyst Keith Ng was there for English’s OS/OS debut. He watched it with a mixture of interest and skepticism, but says it’s worthwhile to make a distinction between what O’Neil is talking about versus what New Zealand is doing.
“The algorithm-driven decisions, stuff like what a lot of tech companies use, is probably quite different to what we’re talking about in a New Zealand context,” Ng says.
Take Airbnb for example, he says: “There might be a bit of implicit racism in how people choose to rate other people or who they choose to rent out their things to. Machine learning algorithms tend to pick up those kinds of behavioural patterns and then they tend to reinforce them.”
But that’s not what’s necessarily being talked about in terms of data-driven policy making, where the predictive methods are much more human driven.
“The distinction is really important - because those things are really a product of human experience, expert experience and expert knowledge, experts have looked at it and gone look, we think these things are important so we’re putting these things in.”
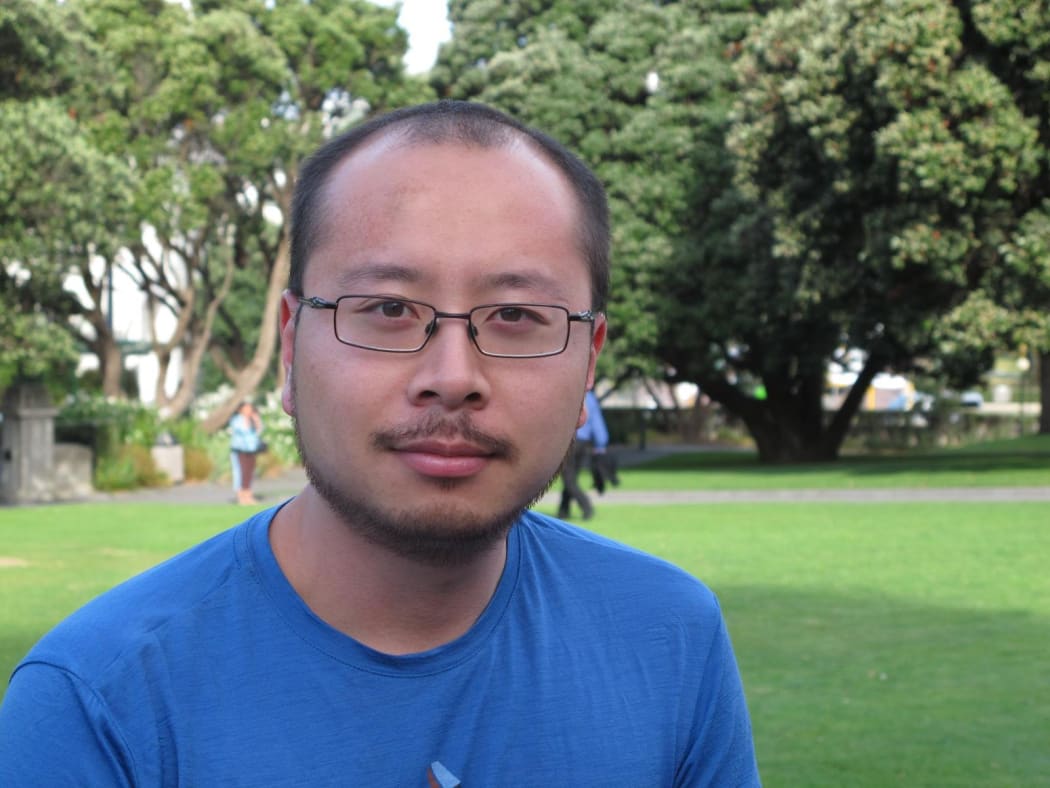
Data visualisation consultant Keith Ng says there are limits to what we can measure. Photo: Supplied
But that doesn’t mean there aren’t potential pitfalls. Some things, he says, are simply hard to measure.
Imagine if you had a data-driven policy model for the civil rights movement in America, Ng says. When it first started, the measurable outcomes would look bad: violence going up, civil unrest, people increasingly unhappy. “You would can the process immediately,” he says.
“The takeaway from that is there are some things you can measure but there are some things that you can’t. There are concepts behind why the civil rights movement was a good thing that are actually really difficult to measure. It’s not that people don’t want to measure them or don’t recognise that they’re there it’s just that if you can’t count it, you can’t put it into an algorithm.
“The other element is sometimes things need to get a lot worse before they get better. But if you purely look at the data set, and if you look at it in a short cycle, it’s very difficult for those big projects, the sort of big societal changes to actually occur.”